Heading goes here
PLEASE NOTE THAT THIS INVESTACALC HELP PAGE IS UNDERGOING SUBSTANTIAL UPDATING TO REFLECT THE LATEST VERSION.
IT IS HOPED THAT THE UPDATE WILL BE COMPLETED IN THE NEXT FEW DAYS.
THANK YOU FOR YOUR PATIENCE.
Compare the performance of investment schemes
Compare the impact of different fee structures on capital and savings
Calculate saving targets and shortfalls
Calculates the effect of withdrawals and drawdowns on capital
Estimate the impact of cash flow and income requirements on the investment performance
DISCLAIMER:
iNVESTaCALC app is published to provide information. No action should be taken without consulting the detailed legislation or seeking professional advice. Therefore no responsibility for loss or occasioned by any person acting or refraining from action as a result of the material contained in this app can be accepted by its authors. Whilst every effort has been made to ensure the accuracy of iNVESTaCALC, its authors accept no liability for any errors or omissions.
CONTACT:
iNVESTaCALC INCLUDES:
- A Welcome window providing link to analysis windows and worked examples
- Default Analysis (1) window
- Analysis (2) Goal-Seek window
- Cash Flow Window
- App Help Window
- 5 worked examples available from the Welcome window and any of the analysis windows

The following three sections give a brief description of iNVESTaCALC. Followed by detailed descriptions and guidelines.
DEFAULT WINDOW ANALYSIS (1)
This window comprises a data entry section, green, orange and blue boxes, and a result output section of white boxes. You can enter the Scheme details, calculate outcome at end of Scheme Term by clicking on the Calculate button, see example below. You will also be able to see how your Final Capital varies over time during the Scheme. Change the Scheme details and recalculate as needed.

If you enter data that may cause the calculator to crash a warning pane will appear when you click on the calculate button. The warning pane will suggest what change to the input data is needed.
You can save the scheme details, outcomes, and the plot to a folder on your hard drive simply press ‘Save As’ on the Analysis (1) window tool bar to bring up the standard Save As panel. You can also print the data and plot using an air-print capable printer, or save it as a PDF file by clicking on ‘Print’ on the right hand of the window tool bar which will bring up the standard Print panel.
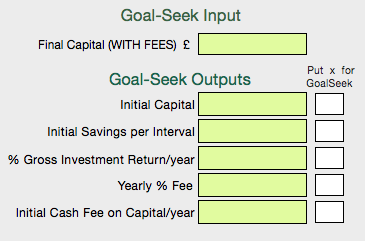
ANALYSIS (2) GOAL-SEEK WINDOW:
The Goal-Seek window is accessed by clicking on the ‘Analysis (2) Goal-Seek’ icon on the Analysis (1) window tool bar.
The Analysis(2) Goal-Seek window is similar to the Analysis (1) window but includes a Goal-Seek capability.
The addition of a Goal-Seek capability allows you estimate the following to achieve a required Final Capital:
The Initial Capital
The Saving requirements
The % gross Investment Return/year
The % Yearly Fees
The Initial Cash Fees on Capital/year
You can save the scheme details, outcomes, and the plot to a folder on your hard drive simply press ‘Save As’ on the Analysis (2) window tool bar to bring up the standard Save As panel. You can also print the data and plot using an air-print capable printer, or save it as a PDF file by clicking on ‘Print’ on the right hand of the window tool bar which will bring up the standard Print panel.

CASH FLOW WINDOW:
The Cash Flow can be opened from either Analysis windows. Normally used with the Analysis (1) or (2) windows, it provides a graphical view of your total gross monthly and yearly income made up of a number of income streams. The Savings and Withdrawals are the same as the Savings and Withdrawals entered in the Investment performance analysis of Analysis (1) or (2).
Each income stream is labelled and shaded in a different colour. The sum of the income streams for any month is the total gross income for that month. Each blue circle is the yearly gross income, using the right hand Y axis, calculated from the previous twelve months gross total monthly income.

DETAILED APP DESCRIPTION AND HELP NOTES:
Two analysis panels are available, the default ANALYSIS (1) window and the ANALYSIS (2) GOAL-SEEK window which can be accessed from the ANALYSIS (1) window tool-bar:
Note also that the input data and the results can be saved to a file on the hard drive by clicking on the ‘Save As’ icon at the top left of each panel tool bar.
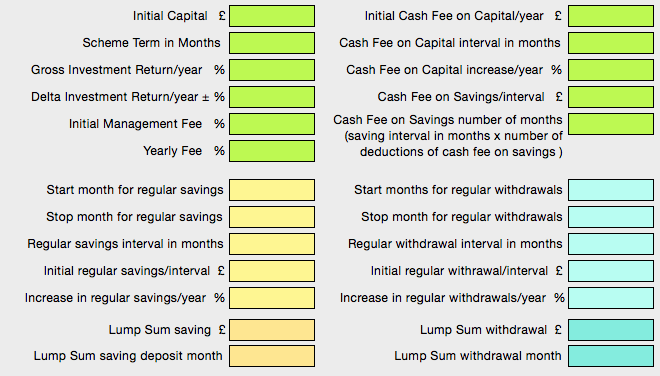
ANALYSIS (1) WINDOW:
The default Analysis(1) window is shown below with example data.
There are three main input sections:
If you make an error in your input data that will cause the analysis to freeze when you clicl the calculate button a warning box will appear to guide you, see example below.
In this example the Term must be greater than zero months.

When you have finished entering the input data, you click on the ‘Calculate’ button and the output data will appear in the white boxes as appropriate, and a plot of your Final Capital over time will appear on the right of the window. If you enter any data incorrectly a warning panel will appear to highlight the problem and guide you how to correct it.
If you want to know the value of the Final Capital for any particular month just enter the month in the ‘Capital output month’ box and then click Calculate.
The App Help Notes, Save As, and Analysis(2) Goal-Seek windows respectively can be opened by clicking on the respective icons on the tool bar.
SAVING AND VIEWING THE DATA:
If you want to save the data to a file on your hard drive enter the File Name at the top left of the window, click Calculate, then click on either of the Save Data buttons. A window will appear asking you how you want to save the data. Click on one the button to save the data as required, see example below:

To view the saved data:
- Click on the Saved-Docs button at the top right of the main window toolbar
- Choose the device storage by flicking the Storage switch left or right, in this example its set to ‘Device Storage’, i.e. the data is save to the iPad
- Enter up to three search term, in this example the search term is ‘Dec’
- Click on the circular arrow
- All the data files which include the search term in their title will appear as shown below
- If you want to see the detail of the file, click on the file title and a detail page will appear, in this example lets say we choose the file ‘C_A1_27Dec.pdf’
- The pdf document, text data and plot, will appear in a detail window, see below
- If you want to delete one or more files click on the edit button, top right

Text data and plot in detail window from example above.

If you want to print the document then click on the print icon at the top right of the detail page, and you will be shown a range of options.

Every time you click on the Calculate button the time stamp at the top of the window will change to the current time, and this will be saved with your data to file.
THE GENERAL ANALYSIS ASSUMES THAT:
1. Fees are applied to Capital + Savings at start of month
2. Yearly Cash Fees on the Capital start at month 1 and can be applied at intervals given below
3. Yearly % Interest is calculated at the end of the month and applied on a monthly basis
4. % Yearly Fees are applied on a monthly basis and calculated on the Capital + any savings at the start of the month
5. Any Withdrawals are taken at taken at the start of the month after any fees are applied
6. Any Cash Fees on the regular Savings at each Saving Interval are applied before adding to the Capital
7. Any % increase in Cash Fees, Savings or Withdrawals are applied at the end of each yearly period compounded each year
NB1: Note that the difference between the FINAL CAPITAL (WITH FEES) and the FINAL CAPITAL (WITH NO FEES) is NOT simply the amount of FEES paid but takes into account the impact of the reduction in INTEREST over the Term of the Scheme as the CAPITAL is reduced by the fees.
NB2: Note that the IMPACT OF CASH FEES is NOT simply the total amount of cash fees paid but takes into account the reduction in Interest accrued over the Term as the CAPITAL is reduced by the CASH FEES.
NB3: Note that the IMPACT OF CASH FEES ON SAVINGS is NOT simply the total amount of CASH FEES ON SAVINGS paid but takes into account the reduction in Interest accrued over the Term as the SAVINGS is reduced by the CASH FEES ON SAVINGS.
THE INPUT DATA REQUIREMENTS ARE AS FOLLOWS:
1. The Term in months can be any number of months and MUST be entered.
2. Any input not required can be left blank, however the Yearly % Interest Rate needs to greater than 0%. If a 0% is needed the %Yearly Interest Rate can be set to a small value such as 0.0001% without significant loss of accuracy.
3.The total number of months over which SAVINGS occur (the SAVING PERIOD), is the difference between the start and stop month. It can be any number of months and does not have to be a full number of years.
4. The total number of months over which WITHDRAWALS occur (the WITHDRAWAL PERIOD), is the difference between the start and stop month. It can be any number of months and does not have to be a full number of years.
5. The SAVING and WITHDRAWAL PERIOD need NOT be the same, the WITHDRAWAL PERIOD may be shorter or longer than the SAVING PERIOD
6. The interval in months between successive SAVING deposits needs to be either; 1, 2, 3, 4, 6, or 12 months
7. The interval in months between successive WITHDRAWALS needs to be either; 1, 2, 3, 4, 6, or 12 months
8. The SAVING and WITHDRAWAL intervals need NOT be the same
9. The initial SAVING or WITH DRAWAL amount per interval is the amount saved/withdrawn per interval in the first year of the SAVING/WITHDRAWAL PERIOD
10. The amount saved/withdrawn can be increased each year of the SAVING/WITHDRAWAL PERIOD, compounded over time
11. As well as % Yearly Management Fees applied monthly, CASH FEES can be applied to the Capital at intervals of 1, 2, 3, 4, 6, or 12 months. The CASH FEES applied to the Capital can be increased by a given % each year.
12. If needed separate CASH FEES can be applied to the SAVINGS deposited at each SAVING interval for a given number of months. The number of months the CASH FEES on SAVINGS are applied needs to be equal to or less that the total SAVING PERIOD.
13. The input data can be changed and the output recalculated until the required output is obtained.
14. When the Calculate button is pressed the Date/Time at the top of the window will be updated. The plot of the Final Capital over time will appear together with the output data as previously. The plot is auto-scaling and will update every time the Calculate button is pressed.
15. The results and input data for either the Analysis (1) and Analysis (2) Goal-Seek windows respectively can be saved to a directory by clicking on the ‘SaveAs’ icon on the right of each Analysis window toolbar. A standard ‘Save-As’ pane is activated in which the suggested file name is the ‘File Name’ input in the Analysis windows. The user can choose the directory as required. At present the output is a formatted text string but it is saved as a .doc file.
16. When opening the .doc file you will be asked what encoding you prefer (the suggested encoding is ‘Unicode6.1 ‘Little-Endian’). You can re-save it as a Word .doc file if needed.
ANALYSIS (2) GOAL-SEEK WINDOW:
The Goal-Seek window is similar to the Analysis(1) window, the main difference being that it doesn’t plot out the Final Capital against time, but it has a Goal-Seek option where you can estimate either the Initial Savings, the Annual % Interest Rate, the Yearly % Fee, or the Initial Capital needed to achieve your Final Capital. The window below shows a typical example of the Initial Capital needed for a saving scheme to achieve a given Final Capital.
THE INPUT DATA REQUIREMENTS ARE AS FOLLOWS:
As with the Analysis(1) window you can change the input data and see its impact very easily by calculating a new set of output data.If you want to save the data to a file on your hard drive enter the File Name at the top left of the window, click Calculate, then click on the Save As icon. A typical Save As panel will open and you can choose a directory and file to save the data to. See below for more details.
1. Every time you click on the Calculate button the time stamp at the top of the window will change to the current time, and this will be saved with your data to file.
2. Any input not required can be left blank, however the Yearly % Interest Rate needs to greater than 0%. If a 0% is needed the %Yearly Interest Rate can be set to a small value such as 0.0001% without significant loss of accuracy.
3.The total number of months over which SAVINGS occur (the SAVING PERIOD), is the difference between the start and stop month. It can be any number of months and does not have to be a full number of years.
4. The total number of months over which WITHDRAWALS occur (the WITHDRAWAL PERIOD), is the difference between the start and stop month. It can be any number of months and does not have to be a full number of years.
5. The SAVING and WITHDRAWAL PERIOD need NOT be the same, the WITHDRAWAL PERIOD may be shorter or longer than the SAVING PERIOD
6. The interval in months between successive SAVING deposits needs to be either; 1, 2, 3, 4, 6, or 12 months
7. The interval in months between successive WITHDRAWALS needs to be either; 1, 2, 3, 4, 6, or 12 months
8. The SAVING and WITHDRAWAL intervals need NOT be the same
9. The initial SAVING or WITH DRAWAL amount per interval is the amount saved/withdrawn per interval in the first year of the SAVING/WITHDRAWAL PERIOD
10. The amount saved/withdrawn can be increased each year of the SAVING/WITHDRAWAL PERIOD, compounded over time
11. As well as % Yearly Management Fees applied monthly, CASH FEES can be applied to the Capital at intervals of 1, 2, 3, 4, 6, or 12 months. The CASH FEES applied to the Capital can be increased by a given % each year.
12. If needed separate CASH FEES can be applied to the SAVINGS deposited at each SAVING interval for a given number of months. The number of months the CASH FEES on SAVINGS are applied needs to be equal to or less that the total SAVING PERIOD.
13. The input data can be changed and the output recalculated until the required output is obtained.
14. When the Calculate button is pressed the Date/Time at the top of the window will be updated. The plot of the Final Capital over time will appear together with the output data as previously. The plot is auto-scaling and will update every time the Calculate button is pressed.
15. The results and input data for either the Analysis (1) and Analysis (2) Goal-Seek windows respectively can be saved to a directory by clicking on the ‘SaveAs’ icon on the right of each Analysis window toolbar. A standard ‘Save-As’ pane is activated in which the suggested file name is the ‘File Name’ input in the Analysis windows. The user can choose the directory as required. At present the output is a formatted text string but it is saved as a .doc file.
16. When opening the .doc file you will be asked what encoding you prefer (the suggested encoding is ‘Unicode6.1 ‘Little-Endian’). You can re-save it as a Word .doc file if needed.
ANALYSIS (2) GOAL-SEEK CAPABILITY:
The Goal-Seek window is similar to the default ANALYSIS (1) window with the addition of a Goal-Seeking capability for Yearly % Fee, Initial Capital, and Yearly Interest Rate for a required Final Capital with fees.
To estimate the Initial Capital needed to achieve the required Final Capital:
For a given regular saving (or none) you can estimate the Initial Capital requirements to achieve the needed Final Capital. The management fees and cash fees on the savings used in the example below are an indicator only as they will vary depending on the Scheme and Financial Advisor’s fee structure.
Enter the required Final Capital, the Yearly % Interest Rate, any Fees, the Term, and any Saving and Withdrawal data as required.
Note that if regular savings are included the plot will show the Initial Savings per period for different amounts of Initial Capital. This is an important plot as you can immediately see the trade off between savings and Initial Capital to achieve the required Final Capital.

Note that if regular savings are not considered then the plot will be similar to that given in the Analysis (1) window, see example below.

To estimate the Yearly % Fee:
It is sometimes necessary to estimate the Yearly % Management Fee to compare schemes from different companies.
Enter the Initial Capital, the required Final Capital, the Term, the Yearly % Interest Rate, any Savings and Withdrawals, and any other fees if they are known.

To estimate the Yearly % Gross Investment Return:
If you have a target Final Capital and want to determine, for example, whether the Initial Capital and regular Savings will be sufficient it will be useful to see whether the Yearly % Interest rate needed is realistic.
Enter the Final Required Capital, the Initial Capital, any Fees, the Term, and any Saving and Withdrawal data as required.

To estimate the Initial Savings requirements:
If you have a target Final Capital and expect the Yearly % Interest rate to be within a fairly narrow band over the medium term then it may be more sensible to estimate the regular Savings needed over the Term.
Enter the Final Required Capital, the Initial Capital, any Fees, the Term, and any Withdrawal data as required. Enter the Savings Start and End months, the Saving Interval, and if needed the expected % increase in Savings per year.

Note that the Initial Savings per interval can be reduced if the % Increase in Savings per year is increased. This may be of help if the amount saved can be increased over time, the Final Saving per Interval over the last year of the Saving Period is given in the general out section.
Click Calculate and the Initial Savings per Interval needed to achieve the Final Capital will appear in the Goal-Seek output area at the bottom right of the window.
CASH FLOW ANALYSIS WINDOW:
The Cash Flow Analysis window is used in conjunction with either the Analysis(1) or Analysis(2) windows.
It can be used in two ways:
1. You could analyse your investment performance using either the Analysis(1) or Analysis(2) windows and then determine the impact on your gross monthly cash flow and gross annual income over the investment term.
2. You could build a suitable gross monthly cash flow and gross annual income over the investment term and then determine the investment performance over the term needed to achieve the required income.
APP HELP WINDOW:
The App Help Window gives a detailed guide on how to use iNVESTaCALC. Just click on the ‘App Help’ icon on the Analysis (1) window to bring up the App Help window, then just scroll down as required.
AHRS 31 Aug
A NOTE ON THE EFFECT OF INFLATION:
Inflation will affect the purchasing power of your Capital, any regular Savings you make, and any Withdrawals or income you take. It is very difficult to estimate the likely inflation in the future, however some simple guidelines will help to minimize any effect.
If the Effective Yearly % Interest rate is greater than inflation your Capital growth is growing faster than inflation and your purchasing power is maintained or increased.
If you are making regular savings it would be wise to set the % Increase in Savings per year to be higher than inflation. This will ensure that the purchasing power of your Savings will be maintained.
If you are withdrawing regular amounts then it would be wise to set the % Increase in Withdrawals per year to be the equal to inflation to maintain your purchasing power.